这篇文章上次修改于 840 天前,可能其部分内容已经发生变化,如有疑问可询问作者。
前言
在使用stackplz打印堆栈的时候,如果关心的是native层,通常会有不错的效果
然而java层的堆栈则不尽人意,往往只有一部分系统的java堆栈信息,以及一堆libart.so的栈
虽然也有base.vdex的栈,但是它并没有给出符号,只有一个偏移信息,但是如果注意APP出现崩溃时,系统的堆栈中是有java方法的符号信息
所以,为什么vdex栈没有符号?
分析
这里以com.wsy.crashcatcher作为分析测试样本,当触发APP崩溃后,得到系统日志如下:
libc    : Fatal signal 6 (SIGABRT), code -6 (SI_TKILL) in tid 20091 (sy.crashcatcher), pid 20091 (sy.crashcatcher)
crash_dump64: obtaining output fd from tombstoned, type: kDebuggerdTombstoneProto
crash_dump64: performing dump of process 20091 (target tid = 20091)
DEBUG   : failed to read /proc/uptime: Permission denied
DEBUG   : *** *** *** *** *** *** *** *** *** *** *** *** *** *** *** ***
DEBUG   : Build fingerprint: 'google/oriole/oriole:12/SQ1D.220205.004/8151327:user/release-keys'
DEBUG   : Revision: 'MP1.0'
DEBUG   : ABI: 'arm64'
DEBUG   : Timestamp: 2024-03-29 11:22:40.718647539+0800
DEBUG   : Process uptime: 0s
DEBUG   : Cmdline: com.wsy.crashcatcher
DEBUG   : pid: 20091, tid: 20091, name: sy.crashcatcher  >>> com.wsy.crashcatcher <<<
DEBUG   : uid: 10596
DEBUG   : tagged_addr_ctrl: 0000000000000001
DEBUG   : signal 6 (SIGABRT), code -6 (SI_TKILL), fault addr --------
DEBUG   :     x0  0000000000000000  x1  0000000000004e7b  x2  0000000000000006  x3  0000000000371abe
DEBUG   :     x4  0000000000000010  x5  0000000000000010  x6  0000000000000010  x7  7f7f7f7f7f7f7f7f
DEBUG   :     x8  0000000000000083  x9  f80910ed343b96cf  x10 0000000000000002  x11 fffffffffffffffd
DEBUG   :     x12 0000007fc60de190  x13 0000000000000013  x14 0000007fc60df4d8  x15 00000171750d4c19
DEBUG   :     x16 000000724b4e0590  x17 000000724b4bdf30  x18 0000007263fec000  x19 b40000712715cf50
DEBUG   :     x20 0000000000000000  x21 b40000712715d018  x22 0000006ec0029280  x23 0000006ec0029280
DEBUG   :     x24 0000007fc60dfac0  x25 b4000070f715d930  x26 000000000000106e  x27 0000006ec0029260
DEBUG   :     x28 0000007fc60df990  x29 0000007fc60df950
DEBUG   :     lr  0000006faf6da73c  sp  0000007fc60df930  pc  000000724b4bdf38  pst 0000000000001000
DEBUG   : backtrace:
DEBUG   :       #00 pc 000000000009cf38  /apex/com.android.runtime/lib64/bionic/libc.so (tgkill+8) (BuildId: 28943f8bb3b7b23557619af9a38223c5)
DEBUG   :       #01 pc 0000000000000738  /data/app/~~c47SF0bWzFt9lBTYuhKMFQ==/com.wsy.crashcatcher-tFpcLE4k0BIqy_GMoOsp9w==/lib/arm64/libtest_crash.so (raiseError(int)+76) (BuildId: ae31108782396b32b8f44f8b6cb9e8c0d3dca249)
DEBUG   :       #02 pc 0000000000000778  /data/app/~~c47SF0bWzFt9lBTYuhKMFQ==/com.wsy.crashcatcher-tFpcLE4k0BIqy_GMoOsp9w==/lib/arm64/libtest_crash.so (Java_com_wsy_crashcatcher_MainActivity_nativeCrash+28) (BuildId: ae31108782396b32b8f44f8b6cb9e8c0d3dca249)
DEBUG   :       #03 pc 0000000000355630  /apex/com.android.art/lib64/libart.so (art_quick_generic_jni_trampoline+144) (BuildId: 41ac8dfed2977c7a168799976d23a7f8)
DEBUG   :       #04 pc 000000000033eba4  /apex/com.android.art/lib64/libart.so (art_quick_invoke_stub+612) (BuildId: 41ac8dfed2977c7a168799976d23a7f8)
DEBUG   :       #05 pc 0000000000512a44  /apex/com.android.art/lib64/libart.so (bool art::interpreter::DoCall<false>(art::ArtMethod*, art::Thread*, art::ShadowFrame&, art::Instruction const*, unsigned short, bool, art::JValue*)+1976) (BuildId: 41ac8dfed2977c7a168799976d23a7f8)
DEBUG   :       #06 pc 0000000000493244  /apex/com.android.art/lib64/libart.so (void art::interpreter::ExecuteSwitchImplCpp<false>(art::interpreter::SwitchImplContext*)+1012) (BuildId: 41ac8dfed2977c7a168799976d23a7f8)
DEBUG   :       #07 pc 0000000000357dd8  /apex/com.android.art/lib64/libart.so (ExecuteSwitchImplAsm+8) (BuildId: 41ac8dfed2977c7a168799976d23a7f8)
DEBUG   :       #08 pc 000000000020849c  /data/app/~~c47SF0bWzFt9lBTYuhKMFQ==/com.wsy.crashcatcher-tFpcLE4k0BIqy_GMoOsp9w==/oat/arm64/base.vdex (com.wsy.crashcatcher.MainActivity.crash+0)
DEBUG : #09 pc 0000000000371b14 /apex/com.android.art/lib64/libart.so (art::interpreter::Execute(art::Thread*, art::CodeItemDataAccessor const&, art::ShadowFrame&, art::JValue, bool, bool) (.__uniq.112435418011751916792819755956732575238.llvm.8722505846101882172)+232) (BuildId: 41ac8dfed2977c7a168799976d23a7f8)关键位置:.../base.vdex (com.wsy.crashcatcher.MainActivity.crash+0)
使用stackplz去追踪堆栈,命令如下:
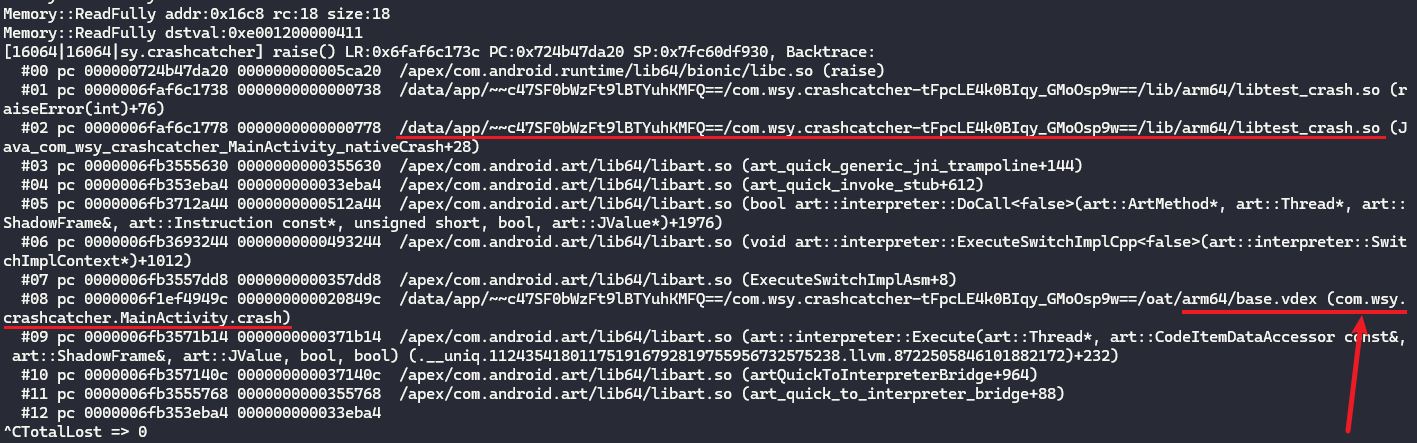
./stackplz -n com.wsy.crashcatcher -w raise --stack --showpc结果如下:
[16064|16064|sy.crashcatcher] raise() LR:0x6faf6c173c PC:0x724b47da20 SP:0x7fc60df930, Backtrace:
  #00 pc 000000724b47da20 000000000005ca20  /apex/com.android.runtime/lib64/bionic/libc.so (raise)
  #01 pc 0000006faf6c1738 0000000000000738  /data/app/~~c47SF0bWzFt9lBTYuhKMFQ==/com.wsy.crashcatcher-tFpcLE4k0BIqy_GMoOsp9w==/lib/arm64/libtest_crash.so (raiseError(int)+76)
  #02 pc 0000006faf6c1778 0000000000000778  /data/app/~~c47SF0bWzFt9lBTYuhKMFQ==/com.wsy.crashcatcher-tFpcLE4k0BIqy_GMoOsp9w==/lib/arm64/libtest_crash.so (Java_com_wsy_crashcatcher_MainActivity_nativeCrash+28)
  #03 pc 0000006fb3555630 0000000000355630  /apex/com.android.art/lib64/libart.so (art_quick_generic_jni_trampoline+144)
  #04 pc 0000006fb353eba4 000000000033eba4  /apex/com.android.art/lib64/libart.so (art_quick_invoke_stub+612)
  #05 pc 0000006fb3712a44 0000000000512a44  /apex/com.android.art/lib64/libart.so (bool art::interpreter::DoCall<false>(art::ArtMethod*, art::Thread*, art::ShadowFrame&, art::Instruction const*, unsigned short, bool, art::JValue*)+1976)
  #06 pc 0000006fb3693244 0000000000493244  /apex/com.android.art/lib64/libart.so (void art::interpreter::ExecuteSwitchImplCpp<false>(art::interpreter::SwitchImplContext*)+1012)
  #07 pc 0000006fb3557dd8 0000000000357dd8  /apex/com.android.art/lib64/libart.so (ExecuteSwitchImplAsm+8)
  #08 pc 0000006f1ef4949c 000000000020849c  /data/app/~~c47SF0bWzFt9lBTYuhKMFQ==/com.wsy.crashcatcher-tFpcLE4k0BIqy_GMoOsp9w==/oat/arm64/base.vdex
#09 pc 0000006fb3571b14 0000000000371b14 /apex/com.android.art/lib64/libart.so (art::interpreter::Execute(art::Thread*, art::CodeItemDataAccessor const&, art::ShadowFrame&, art::JValue, bool, bool) (.__uniq.112435418011751916792819755956732575238.llvm.8722505846101882172)+232)可以看到base.vdex这一行后面并没有java方法的信息
为了找到原因,先分析下系统的堆栈是怎么打印出来的
根据网上的源码分析,可以知道是debuggerd这部分在处理异常发生时的堆栈回溯,也就是tombstone的dump_thread方法
输出日志的地方在log_backtrace方法
关键在于这里,这部分的写法libstackplz中也是类似的,即遍历frames,然后unwinder->FormatFrame
unwinder->SetDisplayBuildID(true);
for (size_t i = 0; i < unwinder->NumFrames(); i++) {
  _LOG(log, logtype::BACKTRACE, "%s%s\n", prefix, unwinder->FormatFrame(i).c_str());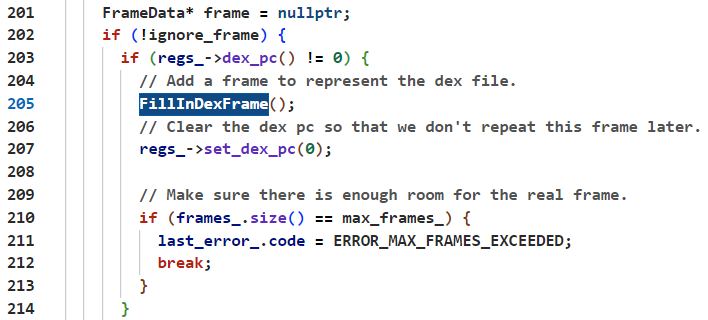
}遍历的时候等于信息已经解析完成了,在这之前都会调用unwinder.Unwind()方法,这里面会通过FillInDexFrame处理有关dex的栈信息
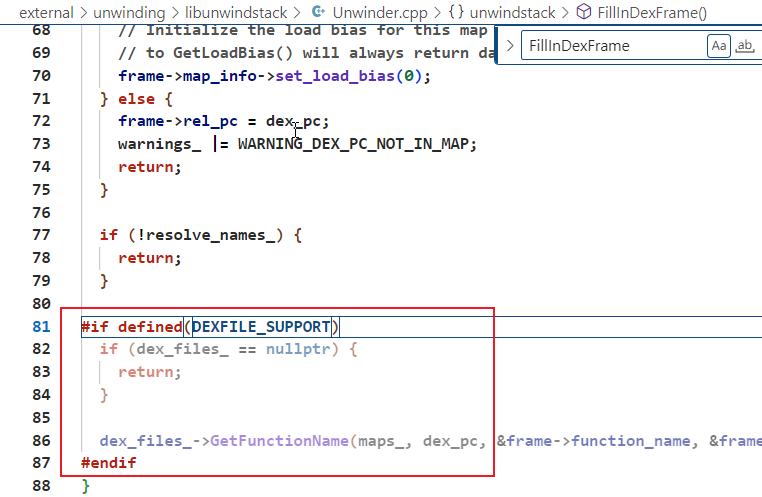
很快就发现这里有一个DEXFILE_SUPPORT宏,然后突然想起来自己是不是没有开这个宏...
#if defined(DEXFILE_SUPPORT)
  if (dex_files_ == nullptr) {
    return;
  }
  dex_files_->GetFunctionName(maps_, dex_pc, &frame->function_name, &frame->function_offset);
#endif果不其然,不管是旧版的Android.bp还是新版的CMakeLists.txt都没有这部分
看起来问题是找到了,于是修改CMakeLists.txt添加开启DEXFILE_SUPPORT宏
不过再次测试发现还是没有效果,在插入了许多log之后,发现原因是FillInDexFrame中dex_files_为null
参考unwindstack的例子,将代码改进如下:
std::unique_ptr<unwindstack::DexFiles> dex_files = CreateDexFiles(unwind_regs->Arch(), stack_memory);
UnwinderWithPC unwinder(512, maps.get(), unwind_regs.get(), stack_memory, opt->show_pc);
unwinder.SetDexFiles(dex_files.get());
unwinder.Unwind();
再次编译,测试,这下出现了一些诡异的现象:不输出堆栈、堆栈不全、堆栈被截断...以及还是没有base.vdex对应的符号信息
问题何在?在对多处位置添加日志后,终于发现了不对的地方
在上面的DEXFILE_SUPPORT部分,会调用dex_files_->GetFunctionName去解析base.vdex对应的符号信息
而这个的具体实现位于unwinding/libunwindstack/GlobalDebugImpl.h,代码如下,这里会调用ForEachSymfile,在其回调中解析
bool GetFunctionName(Maps* maps, uint64_t pc, SharedString* name, uint64_t* offset) {
// NB: If symfiles overlap in PC ranges, this will check all of them.
return ForEachSymfile(maps, pc, [pc, name, offset](Symfile* file) {
    return file->GetFunctionName(pc, name, offset);
});
}
具体来说函数调用顺序如下:
- GetFunctionName unwinding/libunwindstack/GlobalDebugImpl.h
- ForEachSymfile unwinding/libunwindstack/GlobalDebugImpl.h
- FindAndReadVariable unwinding/libunwindstack/Global.cpp
- ReadVariableData unwinding/libunwindstack/GlobalDebugImpl.h
- ReadDescriptor unwinding/libunwindstack/GlobalDebugImpl.h
ReadDescriptor的实现部分代码如下:
在这里通过插入日志发现直接返回了false,也就是this->memory_->ReadFully出现了问题
JITDescriptor desc{};
// Try to read the full descriptor including Android-specific fields.
if (!this->memory_->ReadFully(addr, &desc, kSizeOfDescriptorV2)) {
    // Fallback to just the minimal descriptor.
    // This will make the magic check below fail.
    if (!this->memory_->ReadFully(addr, &desc, kSizeOfDescriptorV1)) {
    return false;
    }
}简单来说是因为内存读取解析的问题,一直是通过CreateOfflineMemory创建Memory对象
std::shared_ptr<unwindstack::Memory> stack_memory = unwindstack::Memory::CreateOfflineMemory(
    reinterpret_cast<const uint8_t*>(stack_buf), stack_addr, stack_addr + stack_size
);
于是最终的读取实现如下
size_t MemoryOfflineBuffer::Read(uint64_t addr, void* dst, size_t size) {
  if (addr < start_ || addr >= end_) {
    return 0;
  }

  size_t read_length = std::min(size, static_cast<size_t>(end_ - addr));
  memcpy(dst, &data_[addr - start_], read_length);
  return read_length;
}上面ReadDescriptor实际上会去读取libart.so的__dex_debug_descriptor全局变量,会用来计算一些东西
通过ebpf获取的栈上数据,只有一小部分,显然这里是读取不到正确的内容的,但是要想知道base.vdex中偏移对应的符号信息,必需通过FillInDexFrame去另外获取到有关dex的信息,去计算解析
现在这里不能正确获取到必要的数据,那么无法得到符号信息也是正常的了
怎么解决呢?通过上面的分析可以知道,这是因为提供的Memory不完整,正确的做法应当是读取原有进程的内存数据
查看系统处理的方法,以及unwindstack的例子,可以知道有下面这些,也就是可以给定进程的pid,这样在读取数据的时候,相关的操作就能正确取到数据了
std::shared_ptr<Memory> Memory::CreateProcessMemory(pid_t pid) {
  if (pid == getpid()) {
    return std::shared_ptr<Memory>(new MemoryLocal());
  }
  return std::shared_ptr<Memory>(new MemoryRemote(pid));
}

std::shared_ptr<Memory> Memory::CreateProcessMemoryCached(pid_t pid) {
  if (pid == getpid()) {
    return std::shared_ptr<Memory>(new MemoryCache(new MemoryLocal()));
  }
  return std::shared_ptr<Memory>(new MemoryCache(new MemoryRemote(pid)));
}

std::shared_ptr<Memory> Memory::CreateProcessMemoryThreadCached(pid_t pid) {
  if (pid == getpid()) {
    return std::shared_ptr<Memory>(new MemoryThreadCache(new MemoryLocal()));
  }
  return std::shared_ptr<Memory>(new MemoryThreadCache(new MemoryRemote(pid)));
}于是将Memory的构造改为unwindstack::Memory::CreateProcessMemory测试,暂时硬编码
std::shared_ptr<unwindstack::Memory> stack_memory = unwindstack::Memory::CreateProcessMemory(16064);这一次有出现了新的状况,那就是堆栈只到so,再往前就是乱的了,有时候是[stack]有时候直接pc就是2
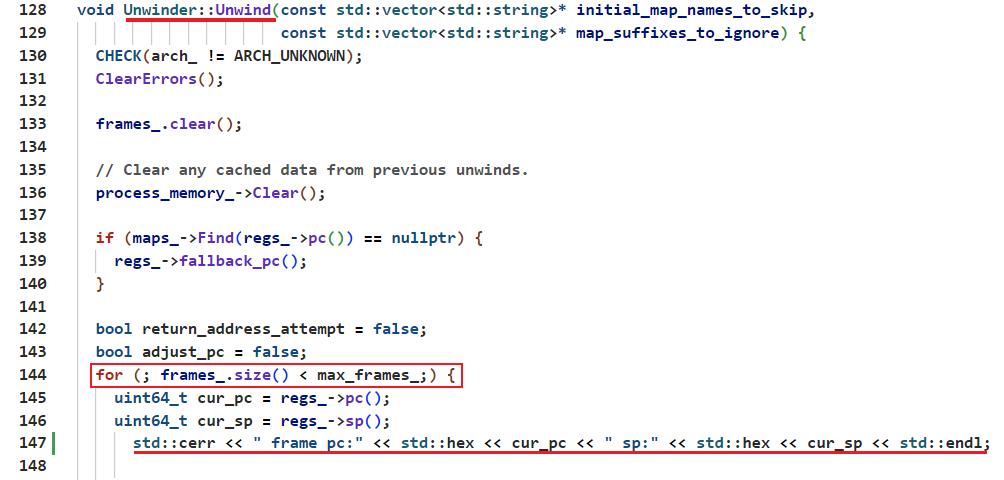
然后在unwinder.Unwind()中遍历解析frame信息的时候,输出pc信息,进行确定
为什么使用CreateOfflineMemory的时候虽然不出base.vdex的符号信息,但是还是有很完整的堆栈呢?
思考比较其中的差异,想到系统回溯的时候,进程原有的上下文执行已经停止,切换到信号注册的回调函数中在操作
于是加上--kill SIGSTOP,终于出现了带有base.vdex符号信息的输出
至此,关于vdex栈没有符号的原因基本上清楚了:
- 一是一直以来没有开启
DEXFILE_SUPPORT宏 - 二是java的执行本身有一套处理机制,要正确获取到dex的符号信息,做解析时上下文不能变,也就是要么进程被挂起,要么是在原进程中的信号注册的回调函数中处理
堆栈不完整、被截断是为何?
经过测试,发现只要加上了unwinder.SetDexFiles这部分就会出现问题...最开始以为是cgo之间的转换问题
推测有关dex的处理有些奇怪的bug,具体为什么我也搞不懂...
最后发现如果加上--showpc选项就不会出现截断的情况,很迷...
最终在此commit之后实现了对vdex/jar栈的符号解析,基于AndroidRemoteUnwinder实现
此项特性已加入stackplz,选项为--jstack,但使用时需要结合信号功能一并使用,即--kill SIGSTOP
示例:
./stackplz_arm64 -n com.wsy.crashcatcher -w raise --stack --jstack --kill SIGSTOP总结
vdex栈的解析实际上涉及许多额外的处理,幸好unwindstack库已经完成了具体细节的实现,而我,只需要调用API...
没有评论