这篇文章上次修改于 1350 天前,可能其部分内容已经发生变化,如有疑问可询问作者。
前言
根据evilpan的文章可以知道,要追踪用户态程序,uprobe能做的也很多
这个实践起来相对比较简单
记录
demo.c测试源代码如下
#include <stdio.h>

void foo() {
    printf("hello, uprobe!\n");
}

int main() {
    foo();
    return 0;
}
通过下面的代码编译可执行程序
/home/kali/android-ndk-r23b/toolchains/llvm/prebuilt/linux-x86_64/bin/aarch64-linux-android29-clang src/demo.c -o demo推送到手机,添加可执行权限
adb push demo /data/local/tmp/demo
chmod +x /data/local/tmp/demo
查看可执行程序对应的foo函数偏移信息
readelf -s /data/local/tmp/demo | grep foo写入事件,其实还有很具体的指令,这里是简单的用法
echo 'p /data/local/tmp/demo:0x1710' > /sys/kernel/debug/tracing/uprobe_events然后会在/sys/kernel/debug/tracing/events/uprobes下生成一个p_demo_0x1710文件夹,根据上面的命令不同,这个文件夹名也是有变化的
先开另一个shell
cat /sys/kernel/debug/tracing/trace_pipe | grep demo开启追踪
echo 1 > /sys/kernel/debug/tracing/events/uprobes/p_demo_0x1710/enable开启输出
echo 1 > /sys/kernel/debug/tracing/tracing_on这个时候惊奇的发现没有任何输出,这个时候把/sys/kernel/debug/tracing/events/uprobes/enable打开,然后再运行demo程序,发现又有了
echo 1 > /sys/kernel/debug/tracing/events/uprobes/enable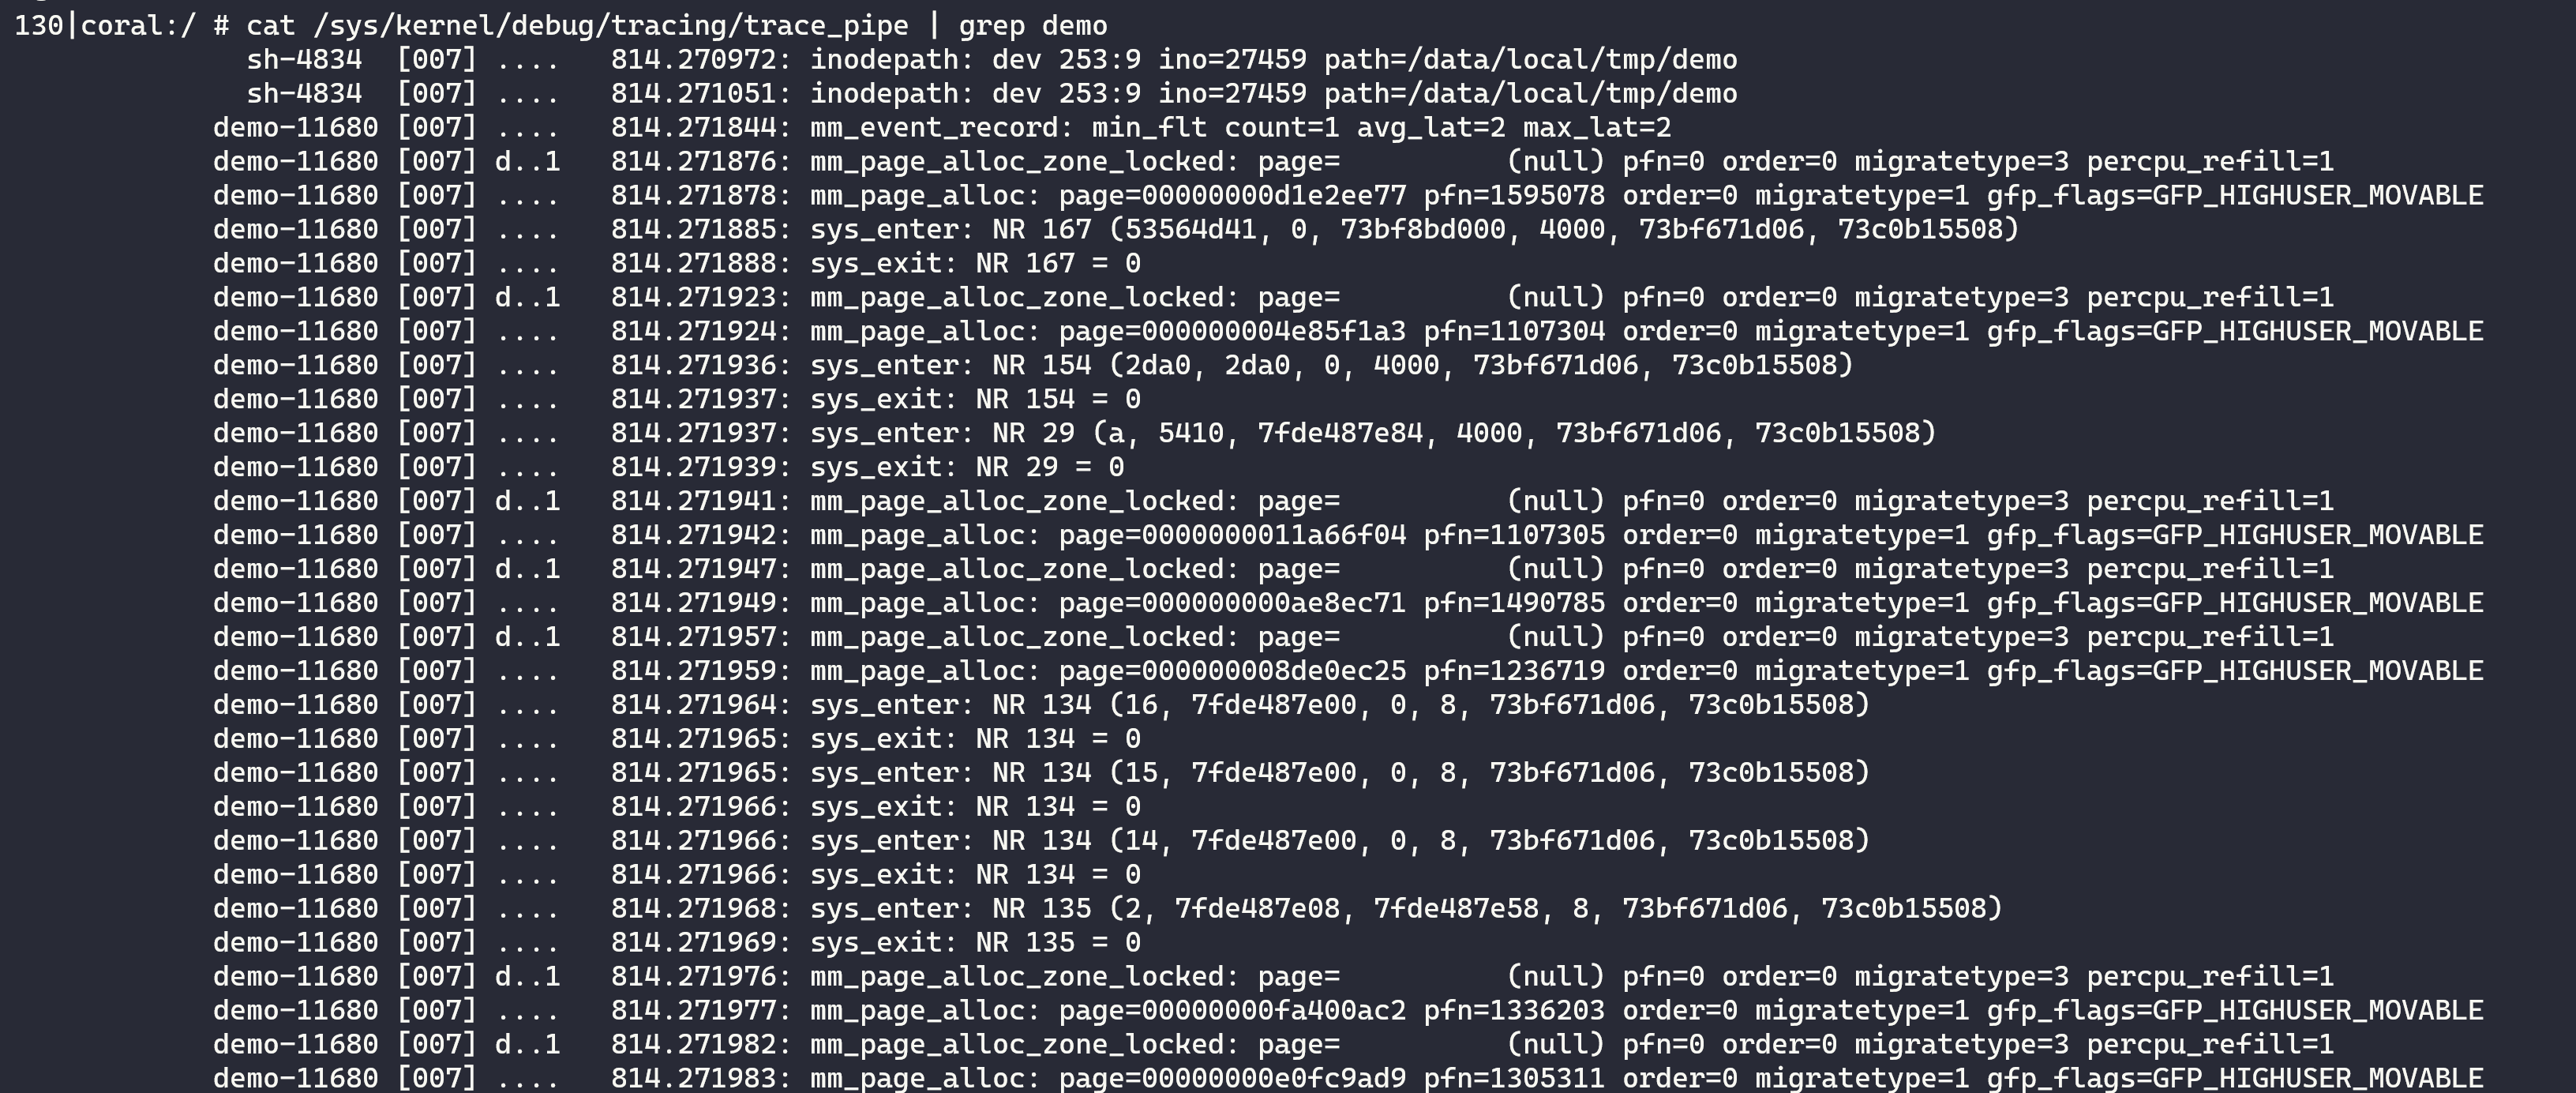
这是为什么呢,然后发现可能是因为当前内核不支持...
coral:/ # cat /sys/kernel/debug/tracing/current_tracer
nop
coral:/ # cat /sys/kernel/debug/tracing/available_tracers
nop
相关资料
所以只能输出系统自带的那些uprobe事件
至此,虽然没有和evilpan的效果一致,但是也勉强算80%的Hello World了...
有关trace的用法在/sys/kernel/debug/tracing/README中
cat /sys/kernel/debug/tracing/READMEtracing mini-HOWTO:
# echo 0 > tracing_on : quick way to disable tracing
# echo 1 > tracing_on : quick way to re-enable tracing
Important files:
trace - The static contents of the buffer
To clear the buffer write into this file: echo > trace
trace_pipe - A consuming read to see the contents of the buffer
current_tracer - function and latency tracers
available_tracers - list of configured tracers for current_tracer
buffer_size_kb - view and modify size of per cpu buffer
buffer_total_size_kb - view total size of all cpu buffers
trace_clock -change the clock used to order events
local: Per cpu clock but may not be synced across CPUs
global: Synced across CPUs but slows tracing down.
counter: Not a clock, but just an increment
uptime: Jiffy counter from time of boot
perf: Same clock that perf events use
trace_marker - Writes into this file writes into the kernel buffer
trace_marker_raw - Writes into this file writes binary data into the kernel buffer
tracing_cpumask - Limit which CPUs to trace
instances - Make sub-buffers with: mkdir instances/foo
Remove sub-buffer with rmdir
trace_options - Set format or modify how tracing happens
Disable an option by adding a suffix 'no' to the
option name
saved_cmdlines_size - echo command number in here to store comm-pid list
uprobe_events - Add/remove/show the userspace dynamic events
Write into this file to define/undefine new trace events.
accepts: event-definitions (one definition per line)
Format: p[:[<group>/]<event>] <place> [<args>]
r[maxactive][:[<group>/]<event>] <place> [<args>]
-:[<group>/]<event>
place: <path>:<offset>
args: <name>=fetcharg[:type]
fetcharg: %<register>, @<address>, @<symbol>[+|-<offset>],
$stack<index>, $stack, $retval, $comm
type: s8/16/32/64, u8/16/32/64, x8/16/32/64, string,
b<bit-width>@<bit-offset>/<container-size>
events/ - Directory containing all trace event subsystems:
enable - Write 0/1 to enable/disable tracing of all events
events/<system>/ - Directory containing all trace events for <system>:
enable - Write 0/1 to enable/disable tracing of all <system>
events
filter - If set, only events passing filter are traced
events/<system>/<event>/ - Directory containing control files for
<event>:
enable - Write 0/1 to enable/disable tracing of <event>
filter - If set, only events passing filter are traced
trigger - If set, a command to perform when event is hit
Format: <trigger>[:count][if <filter>]
trigger: traceon, traceoff
enable_event:<system>:<event>
disable_event:<system>:<event>
stacktrace
example: echo traceoff > events/block/block_unplug/trigger
echo traceoff:3 > events/block/block_unplug/trigger
echo 'enable_event:kmem:kmalloc:3 if nr_rq > 1' > \
events/block/block_unplug/trigger
The first disables tracing every time block_unplug is hit.
The second disables tracing the first 3 times block_unplug is hit.
The third enables the kmalloc event the first 3 times block_unplug
is hit and has value of greater than 1 for the 'nr_rq' event field.
Like function triggers, the counter is only decremented if it
enabled or disabled tracing.
To remove a trigger without a count:
echo '!<trigger> > <system>/<event>/trigger
To remove a trigger with a count:
echo '!<trigger>:0 > <system>/<event>/trigger
Filters can be ignored when removing a trigger.
已有 3 条评论
大佬,最近有种新的su方式-kernelsu。有研究吗,我试了华为4.9x内核,好像无法正常工作,首先试了kprobre,这个直接第一屏重启了,然后又试了修改fs手动添加,能开机,但是输入su的时候终端会卡死,而且权限没有变化。
@didiaoing kernelsu有telegram群组,你可以加进去交流。4.9内核非常老了,出现问题是大概率事件,我也不能确定是什么原因,建议直接使用5.10+内核版本的手机进行测试。华为本身改动太多,不建议使用华为的手机进行测试。
下面这两个echo为1了,再 cat看还是0,怎么回事?
echo 1 > /sys/kernel/debug/tracing/events/uprobes/enable
echo 1 > /sys/kernel/debug/tracing/events/uprobes/p_demo_0x1710/enable